
Covid Changed How We Drink
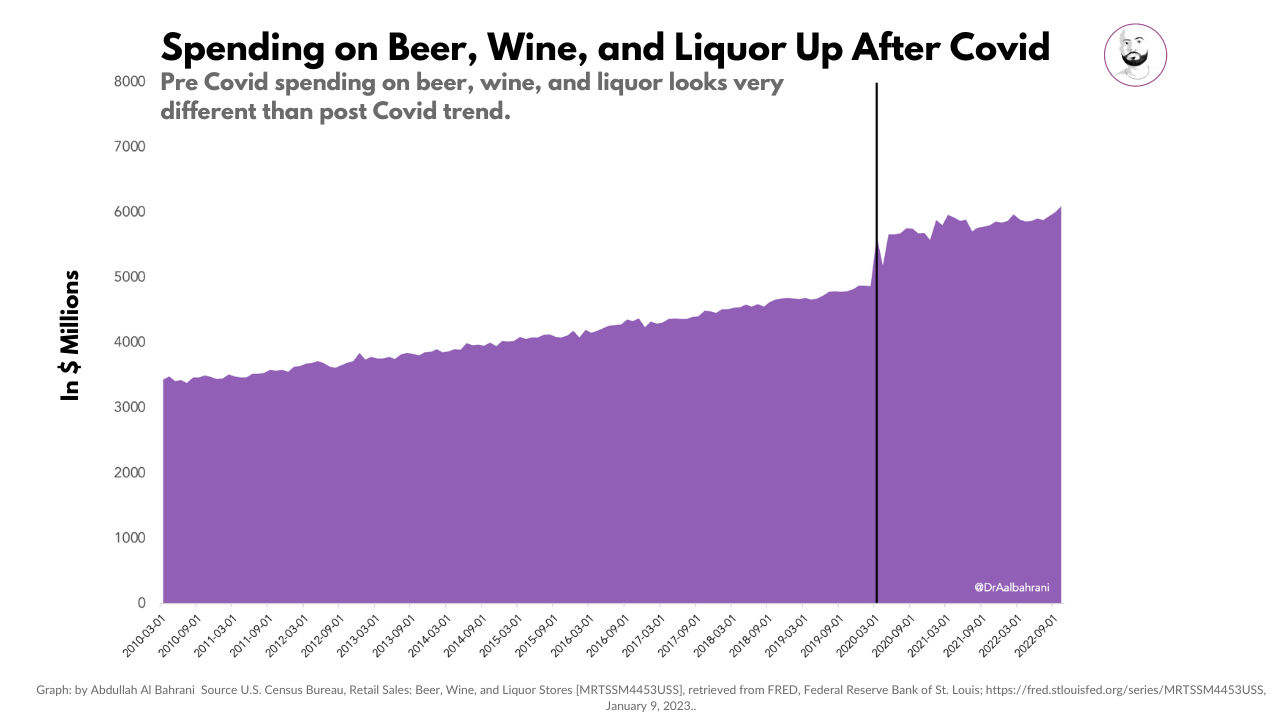
Drinking in the U.S looks very different pre and post Covid. This graph plots retail sales of Beer, Wine, and Liquor in the United States from Q1 2010 to Q3 2022. The pre and post spending trends show a discontinuity (spike) at Q1 of 2020. It looks like this spending behavior is here to stay. I wonder how this looks in other countries.
<
Featured


