
Data Story: How Much Do We Pay In Rent?
Question:
How much do we pay in rent and how has that number changed over time?
Data Story
To answer this question I have to tackle several problems. This will be a 5 step process.
Step 1- Find the Data
First, I have to find data about the rent payments. Luckily, the American Community Survey does ask about how much we pay in rent. The variable rent is reports how much is paid to the landlord in rent. We can see possible measurement error issues because it also includes utilities, fuels..etc when applicable. So comparing rent across people might be an issue, but for now I will ignore it.

Step 2- Calculate Average Rent
Let us import this data into Stata and get some descriptive statistics.
I restrict my analysis to those that only rent. There are 8 million individuals out of 32 million that rent in our dataset. We have the 8 million observations with a mean rent of $968.

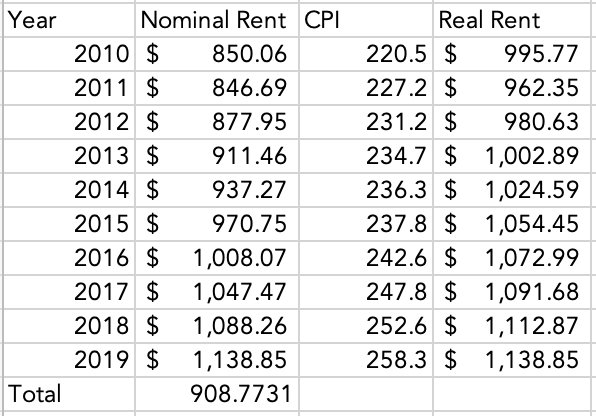
Step 3- Average Rent by Year

This table provides the average rent by year. Do not stop here!
Step 4- Let’s Get Real!
One challenge here is that these are in nominal terms, and to compare across time we need to control for inflation. I download the CPI by year using Federal Reserve Economic Data (FRED).
In Excel I adjust each of the values for inflation and are now in terms of 2019 Dollars. This allows us to control for inflation and provides us with Real rent payment values. Watch the YouTube video for how I converted from nominal to real.
Step 5- Let’s Graph it!

Want to receive these updates via email? Subscribe to my newsletter